PHP/Docker Configuration
If you are developing with Symfony, installed in a docker compose and still not using the debugger, then this article is for you. We are going to show you how to prepare your environment so you no longer have to do dd() or var_dump. Once you have tasted the joys of debugging, you won't be able to do without it, as it will greatly enhance your comfort.
For this article you need to have a Symfony app powered by apache/php (or nginx and fpm, it doesn't matter) with a docker-compose.yml file
The first step is to install xdebug and configure your PHP environment. If you have not done so already, here are the items you must have installed in your Dockerfile.
RUN pecl install xdebug-3.1.6 && docker-php-ext-enable xdebug;Note that if you are using PHP 8.1 you will need to install version 3.2.0
RUN pecl install xdebug-3.2.0 && docker-php-ext-enable xdebug;Personally, I configure my php.ini directly by copying the file from the Dockerfile build.
COPY php.ini /usr/local/etc/php/conf.d/app.iniHere is its content, feel free to install it as you wish.
; conf/php.ini
date.timezone = Europe/Paris

opcache.enable = 1
opcache.enable_cli = 1
opcache.memory_consumption = 256
opcache.max_accelerated_files=20000
opcache.revalidate_freq = 0

upload_max_filesize = 16M
post_max_size = 16M

realpath_cache_size = 4096k
realpath_cache_ttl=600

display_errors = Off
display_startup_errors = Off
max_execution_time=5000
memory_limit = -1

xdebug.mode=debug,develop,trace
xdebug.idekey=docker
xdebug.start_with_request=yes
xdebug.log=/dev/stdout
xdebug.log_level=0
xdebug.client_port=9003
xdebug.client_host=host.docker.internal
Note the entire xdebug part of the file. This is important for the proper operation of the rest of this article. The mode allows us to tell xdebug the options we need.
develop: This will give you an enhanced var_dump in your application but also additional information about warnings, notices. More info here: https://xdebug.org/docs/develop
debug: This will allow you to use step debug, set breakpoints and step through the code line by line.
trace: Records all function calls, variable assignments... everything! It's demanding but no matter.
idekey: Is the key sent by xdebug to tell PhpStorm 'hey, I'm debugging this application, use me!'
client_port: The port to which the debug session's connection socket is sent.
client_host: This is the IP to which we send our connection for the initialization of our debug session. We are using Docker so we will specify how to exit our docker environment to attack the host on our Linux machine.
Once your docker is okay you should have this in your PHP environment:
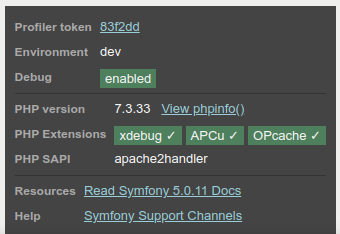
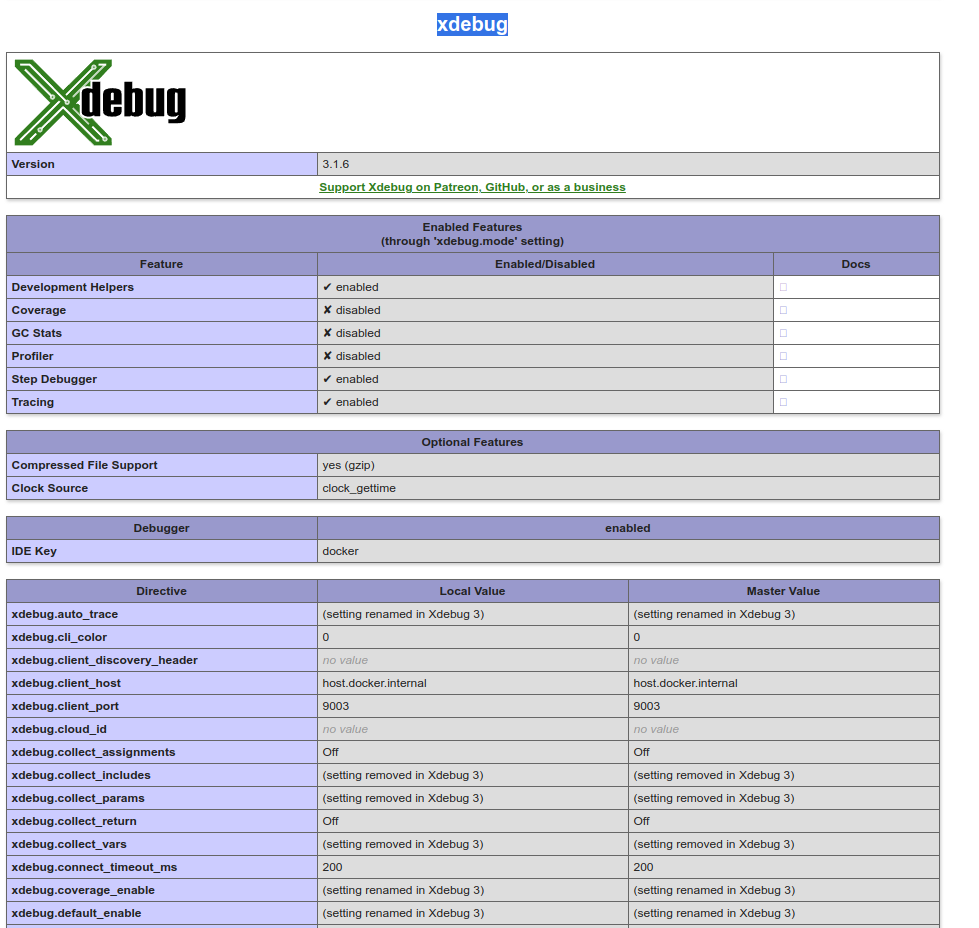
Here is an example of a docker-compose:
version: "3.8"
services:
  php-7.3:
    image: 'devpartitech/php:7.3-apache'
    ports:
      - "80:80"
    volumes:
      - "./:/var/www/"
    extra_hosts:
      - host.docker.internal:host-gateway
Do not proceed to the next step until you have validated this step.
Configuration of PhpStorm
Good! We have our Docker environment set up with a Symfony page. We are going to configure PhpStorm to be able to receive the debug session.
Open the PhpStorm settings.
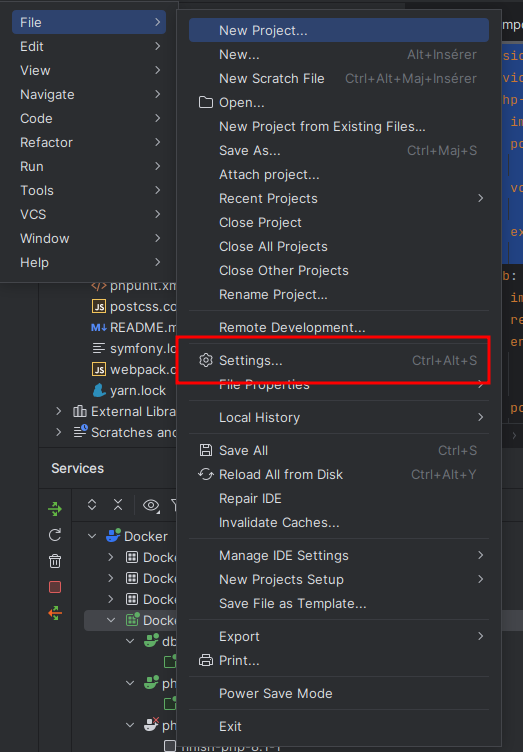
If it's not done yet, install the Symfony plugin.
Under the PHP menu you have the Debug menus.
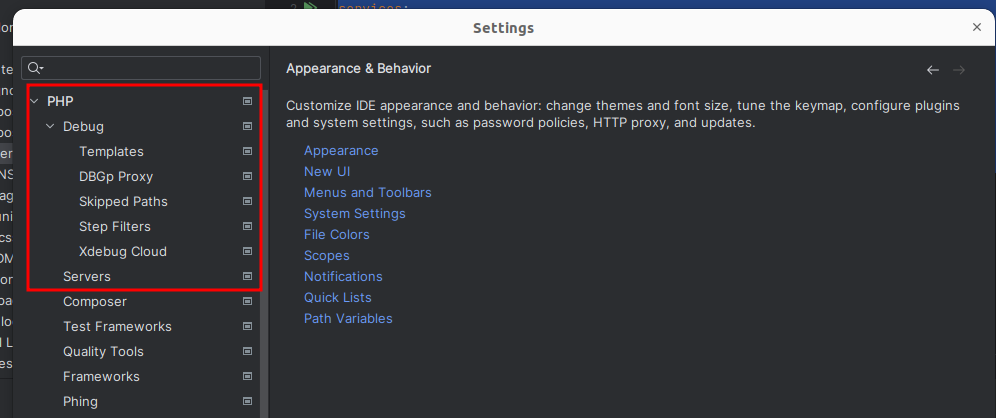
In the first menu specify to your IDE that it must listen to the port 9003. You can change the port if you desire, but it will also need to be specified in the php.ini.
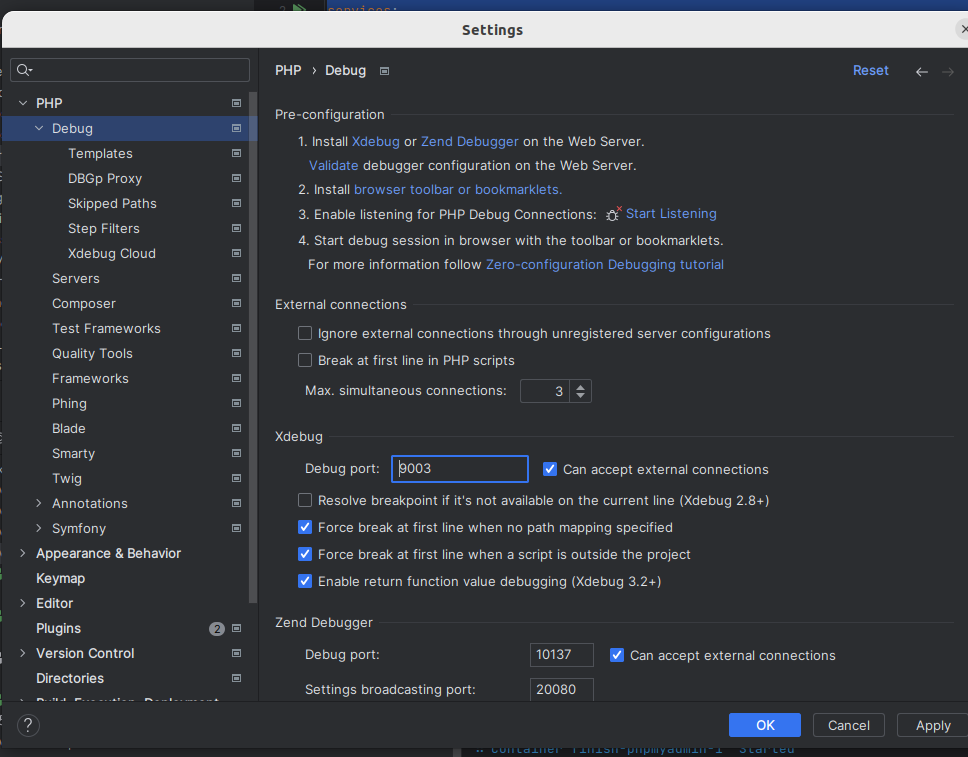
Under the Templates menu put the link to the Symfony var/cache directory. Do not put the path that is in your container. It is about the path on your disk (your machine, for my part Ubuntu). Without this the IDE will not be able to use breakpoints in your TWIG templates.
Under the DBGp Proxy menu:
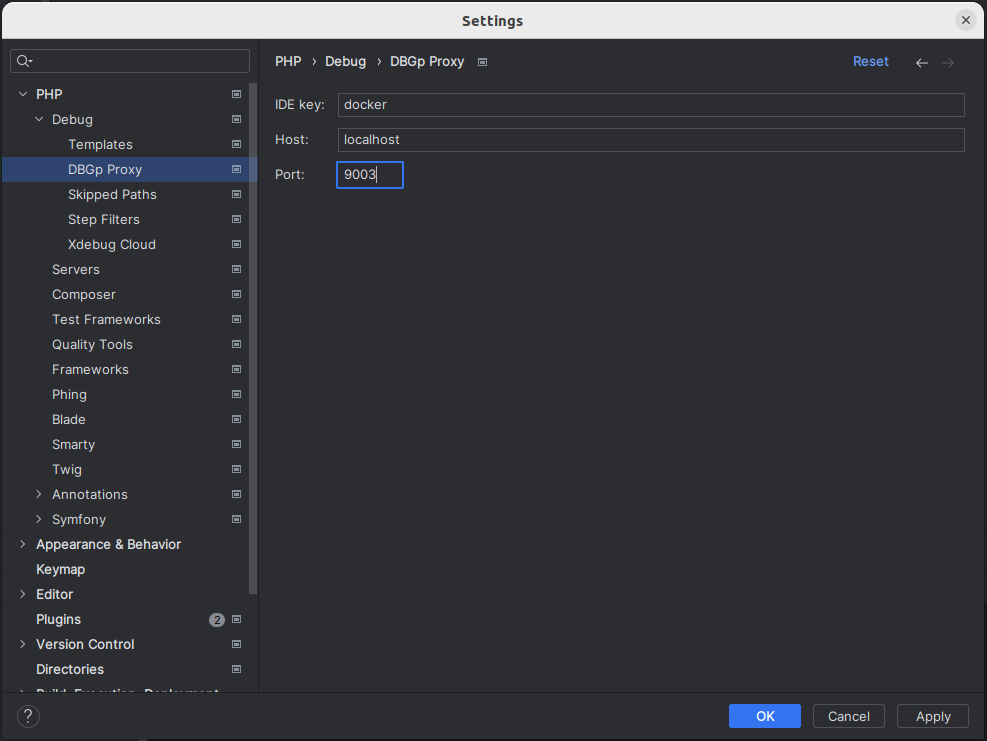
Remember the ide key, and the port from earlier.
Under the Servers menu, create a new server by clicking on the "+".
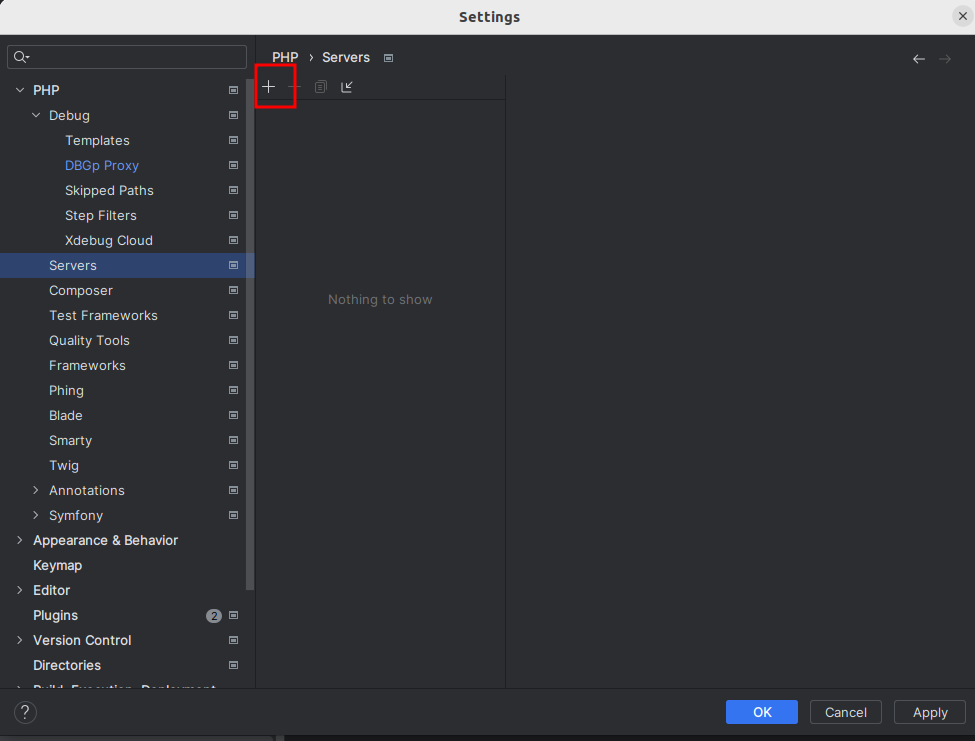
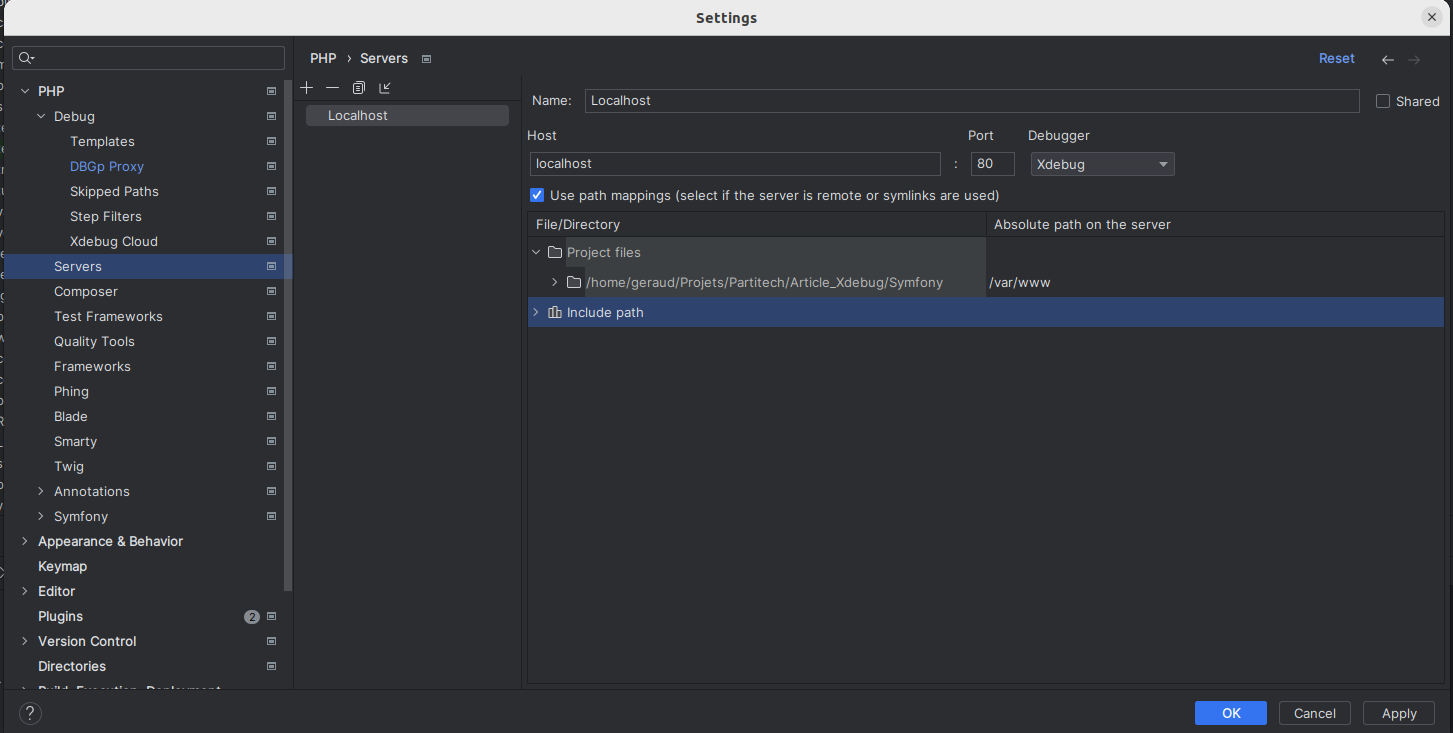
Once your web server is specified we can finally test PhpStorm's debugger!
To test you can go to any Controller and template and put breakpoints. To do this click in the margin (where you have the line numbers).
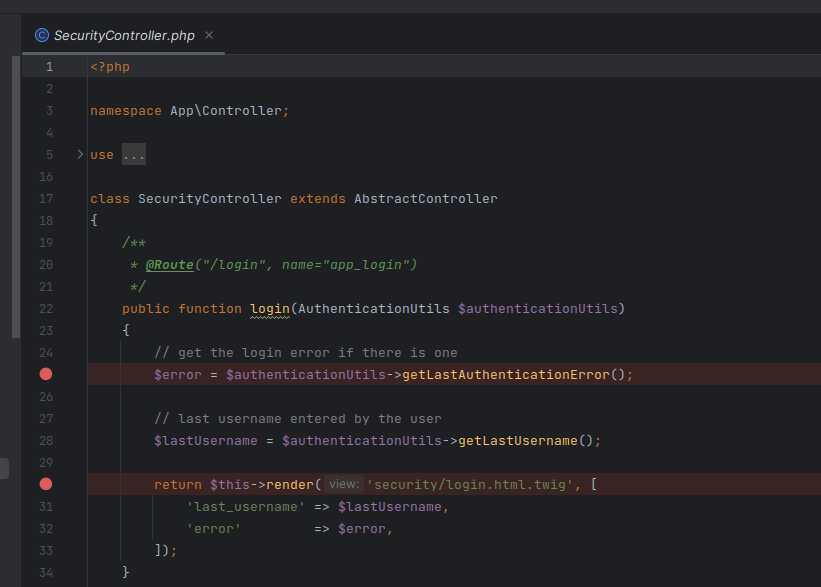
Click on the small "bug" at the top of your IDE
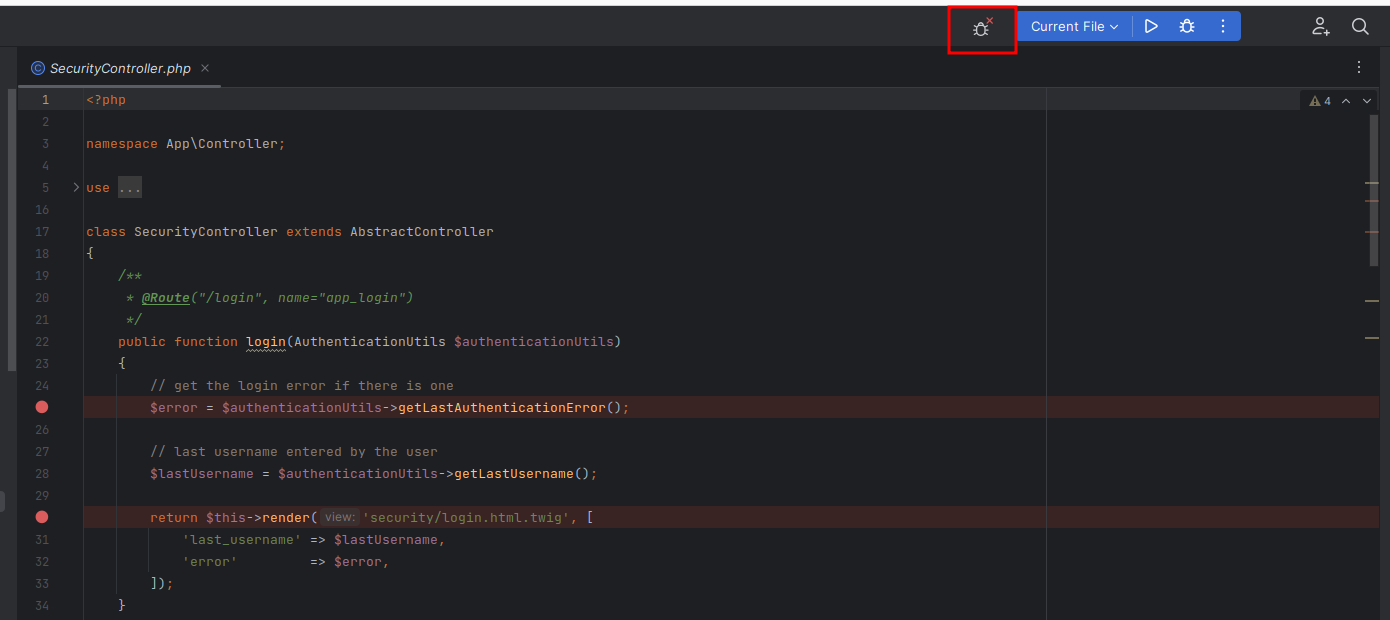
It should switch to "listening" mode
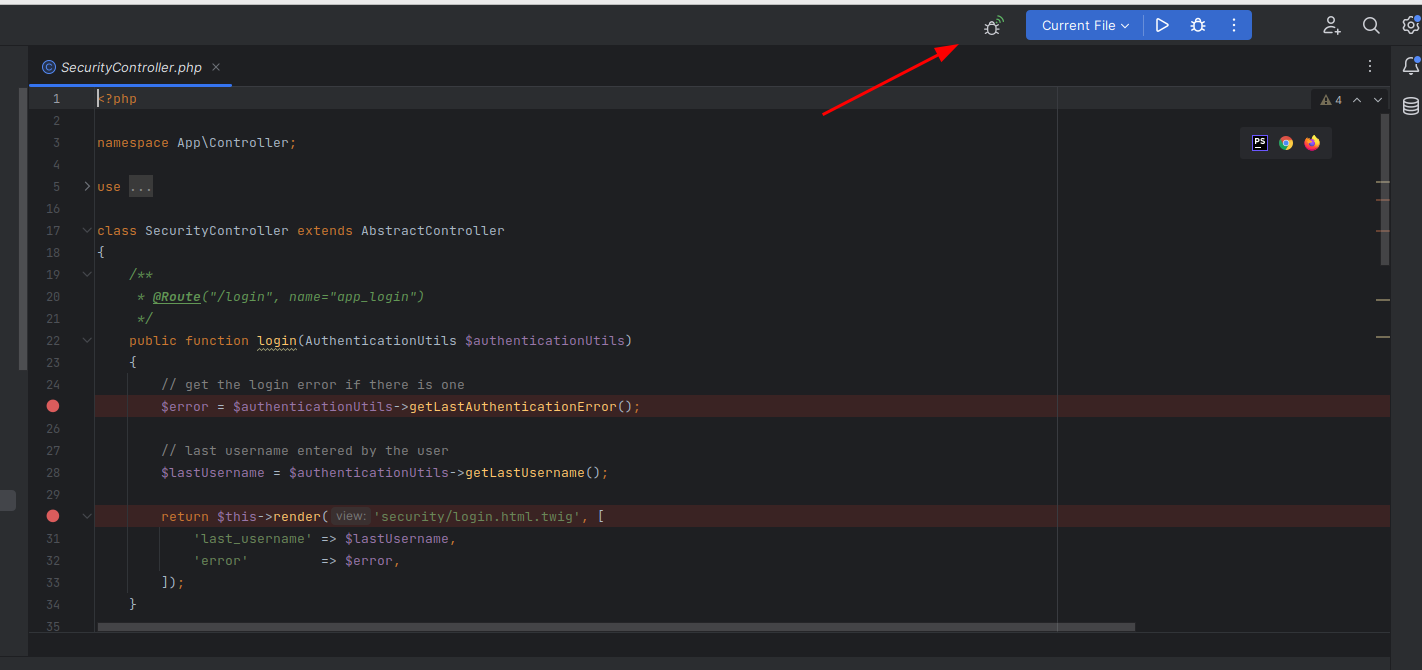
Refresh your web page and you should have access to the debug options 😊
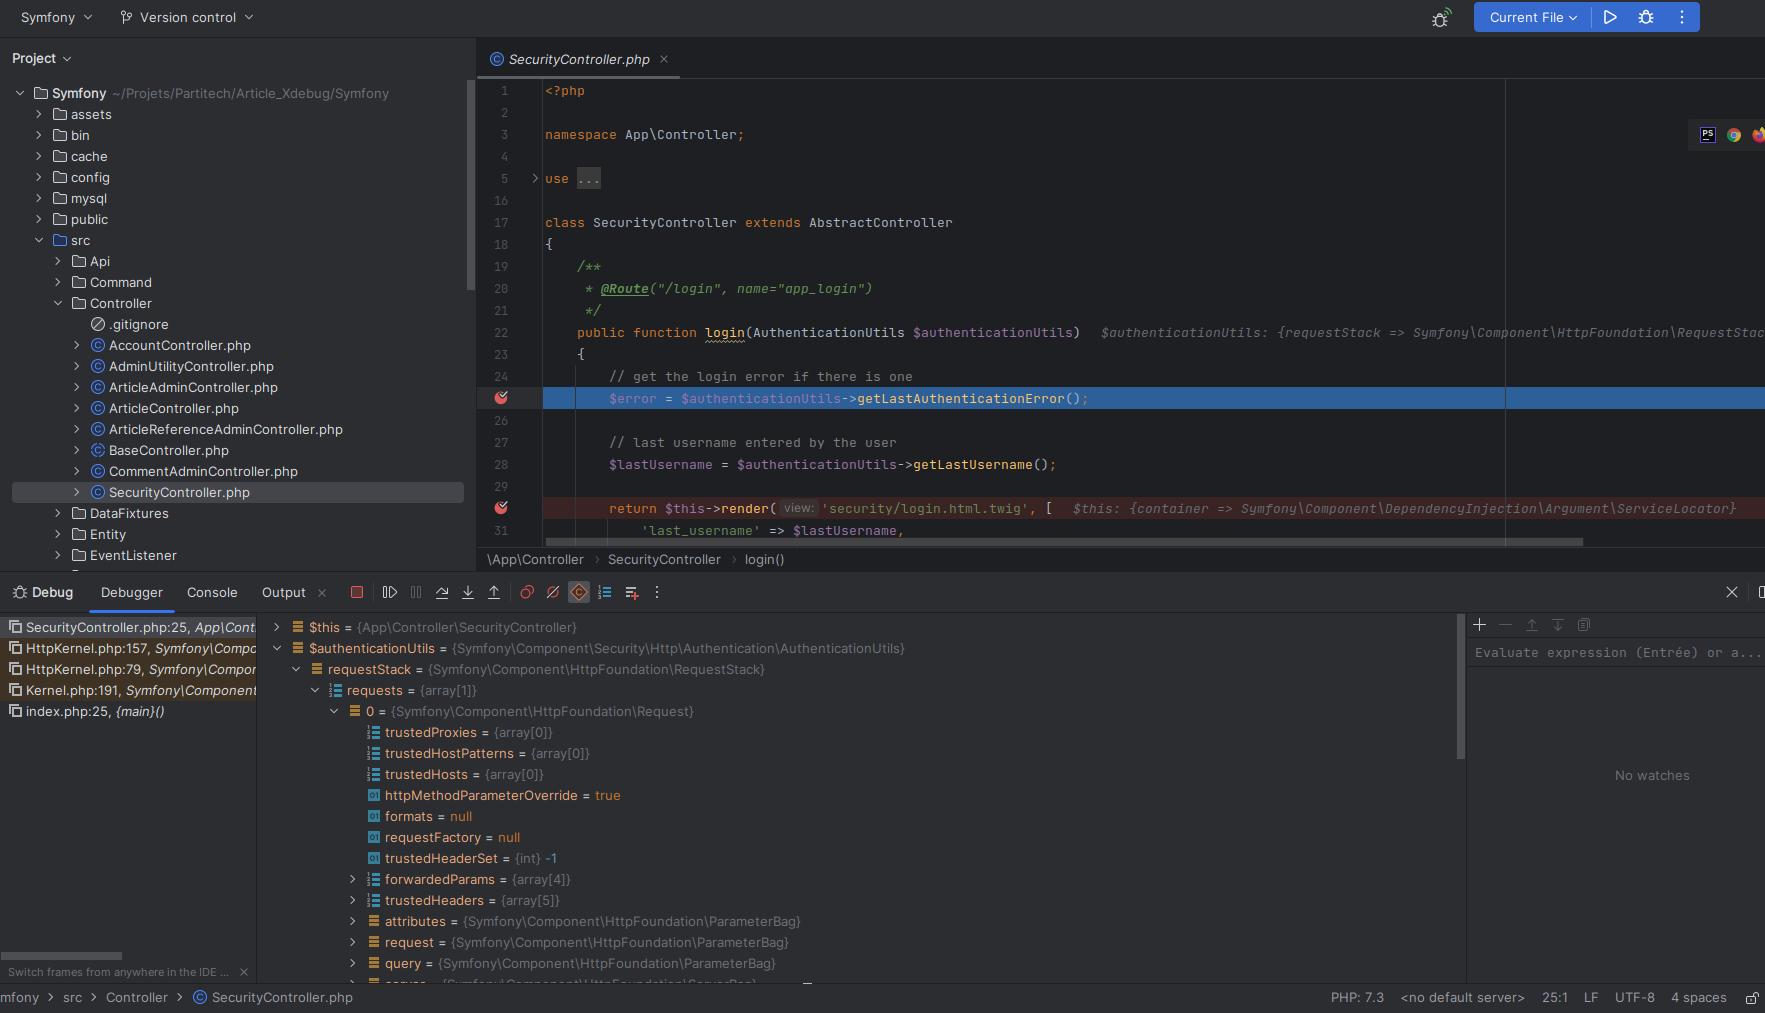
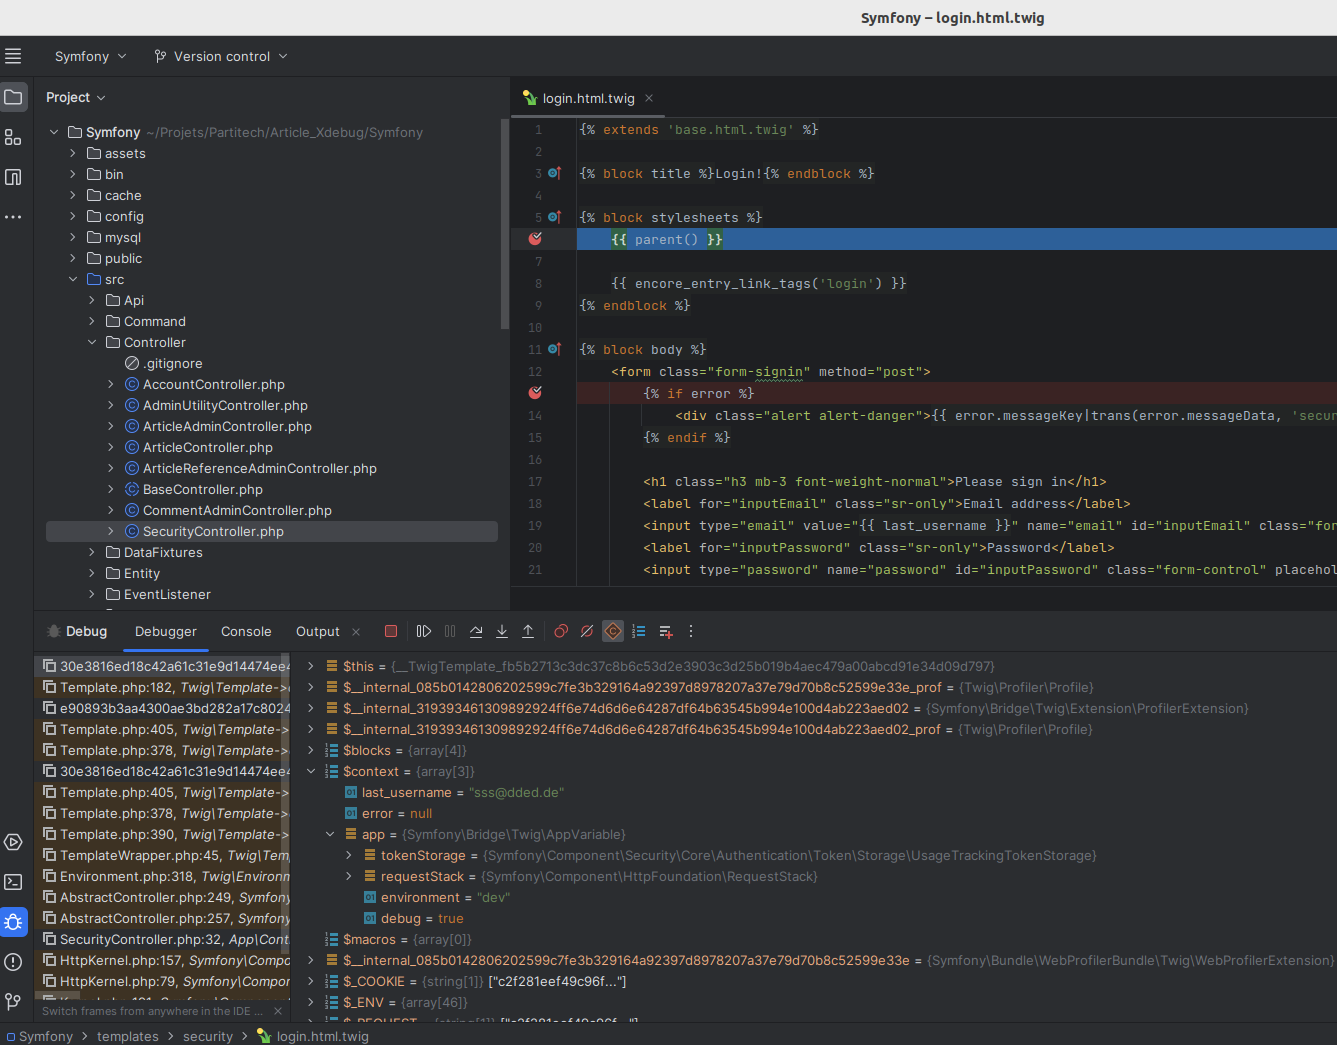
And there you have it!