





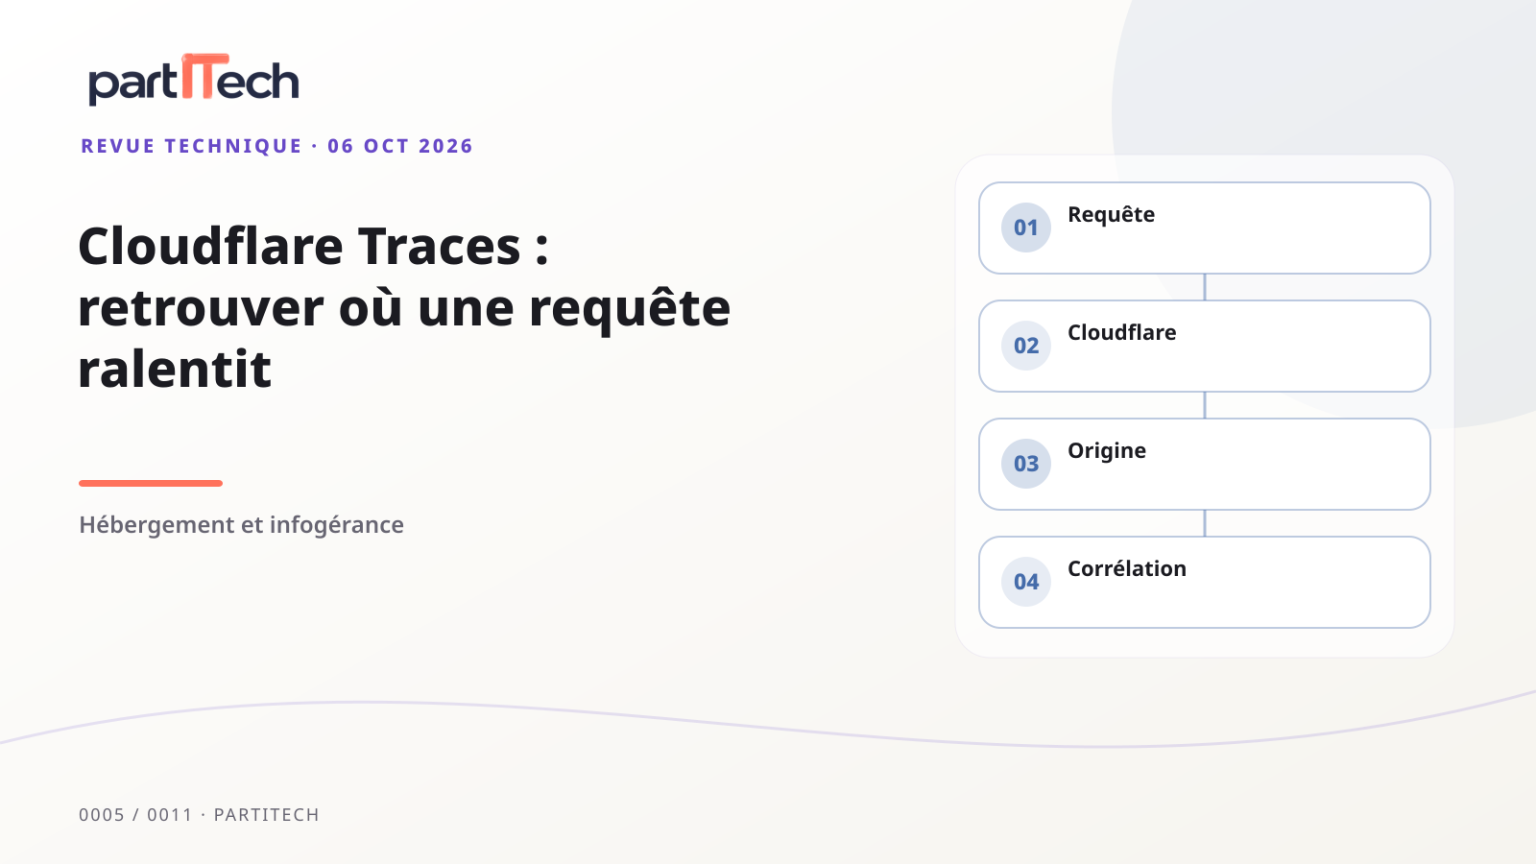
An order tracking page takes a long time to respond. Your application does not report an error, but the user is still waiting. Is the delay coming from the server, a caching decision, or an intermediate step? Cloudflare Traces, announced in beta on October 2, 2026, allows for examining more steps. To derive a diagnosis from it, you still need to link the observations to the correct path.
Start with a request that you can recognize
Let's take a fictional application behind Cloudflare. A browser requests a page, the request passes through the platform and then reaches the application server, called the origin. This server may consult a database or an external service before responding. Each layer only sees part of the work.
An application log can indicate that a page has been served without explaining a wait that occurred before its arrival. Conversely, a network indicator does not necessarily show which application operation took time. A trace gathers steps related to the same request. Each observed step, often called a span, specifies an operation and its place in the journey.
To reason, start with a bounded request whose content you control. Note the route used, the time of issuance, and the elements that allow it to be retrieved. Separate observations from hypotheses: 'the origin received the request' is an observation; 'the database is slowing down the page' remains a hypothesis as long as nothing shows this work.
Your diagnostic sheet must be able to contain empty boxes. A missing layer may correspond to an uninstrumented or non-preserved part. It does not prove that no operation took place there. This principle is useful even with a monitoring tool already installed: the name of a view never guarantees the extent of the evidence.
The announcements of October 2, with their statuses
Cloudflare Traces was announced in open beta on October 2. The publisher describes a journey covering supported operations of security, transformation, caching, routing, Workers and of origin processing. It announces the propagation of the W3C context traceparent, sampling, and an OTLP-compatible export, the OpenTelemetry transmission protocol. Coverage should not be extended to all products by inference. Announcement Cloudflare Traces.
The same day, Cloudflare presented eight developments in Observability, including a common space for logs, a unified SQL API, and beta alerts. Cross-queries between multiple datasets are still announced for later. The new pricing model is scheduled from December 1, 2026, with application upon renewal for Enterprise. Observability Announcement.
| Announced element | What to remember on October 6 |
|---|---|
| Cloudflare Traces | Open beta; check the operations that are actually visible |
| SQL and new alerts | Betas to qualify according to your account and your usage |
| Cross-dataset queries | Future capacity, not to be assumed available |
| Unified pricing | Deadline announced in December, with Enterprise terms |
This table summarizes the announced statuses, not an inventory tested on a Partitech account. It is used to choose what your pilot will have to confirm. Avoid building an incident procedure around a feature that is still in the future.
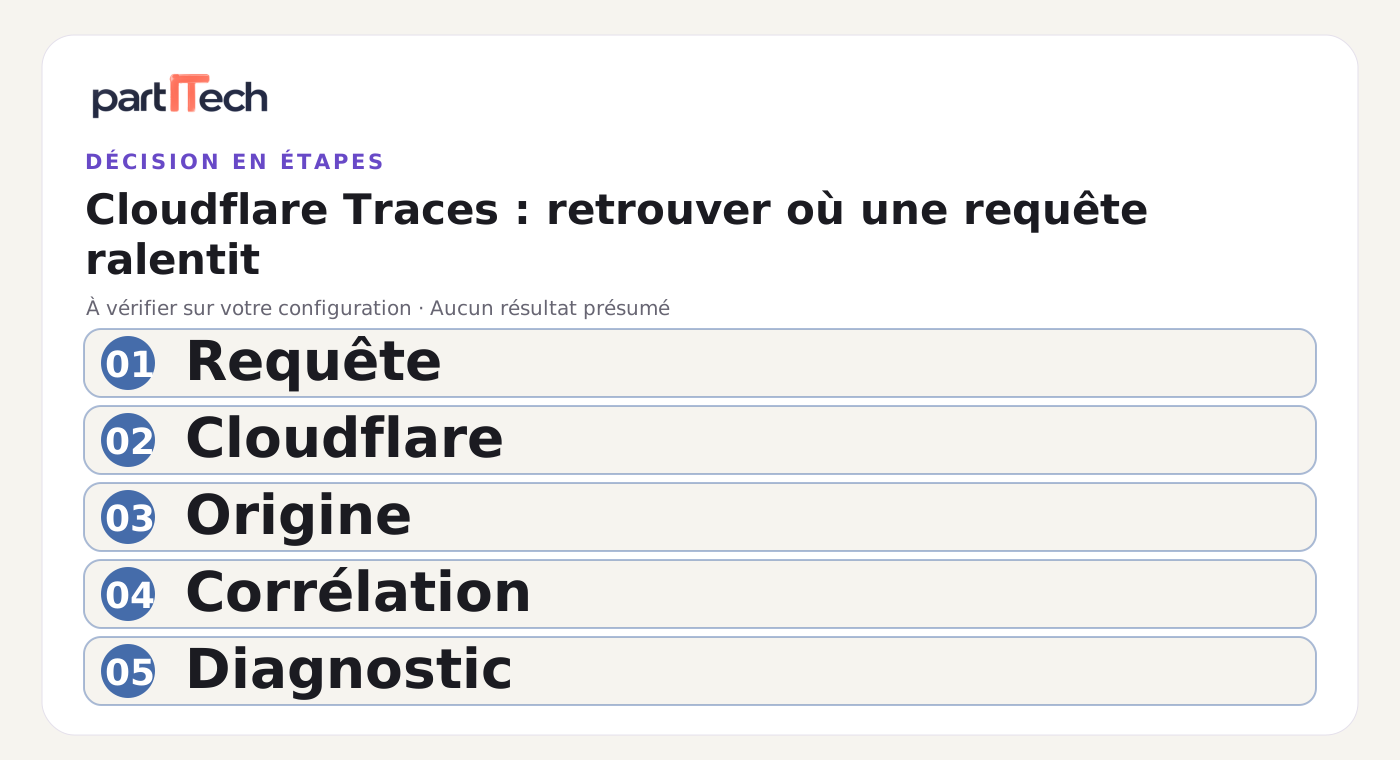
Connect the layers without inventing what they do not show
The trace context is information transmitted between services to recognize a common path. OpenTelemetry provides a set of conventions and tools to instrument an application, that is, to make it describe its operations. A common format facilitates correlation; it does not automatically create missing observations inside your code.
For a Symfony or Laravel application, first look for what is already instrumented: request entry, database access, external call, asynchronous queue. Make a simple map of the boundaries: browser to platform, platform to application, application to dependencies. For each passage, identify who accepts, transmits, or renews the context. Do not add a second collector before understanding the existing path.
An identifier provided by a caller is not an authenticated identity. In our protocol, it is never used to authorize an action or to select a client's file. Define the boundaries where an external context can be taken over, the allowed formats, and the conditions where you resume with an internal context. This architectural recommendation must be adapted to your actual instrumentation.
Also examine asynchronous branches. If the page triggers a job after responding, its duration should not be confused with the waiting time in the browser. The connection between the two operations may remain useful, but you need to explain what you are measuring. Without this distinction, a long secondary task may become a false explanation for the slowness of the page.
Choose the data before choosing the volume
A rich trace can contain information that is not needed for diagnostics. For our fictional page, keeping a standardized route like 'order tracking' is often more useful than keeping a full URL with personal identifiers and parameters. The name of the operation may be sufficient without its business content.
Write a list of allowed fields and a list of exclusions: secrets, cookies, authentication headers, form contents, and response bodies. Check what is collected automatically, what is added by your code, and what is sent to the export destination. Redacting the display does not guarantee that the export is also cleaned.
Sampling consists of retaining a portion of the requests. You are looking for a compromise between useful observations, volumes, and cost. Under normal conditions, set an understandable rule. During an investigation, you can propose a more targeted collection on a synthetic route or test traffic. Cloudflare specifically announces rules allowing the modification of the selection of traced requests. Sampling and Trace Rules.
A temporary rule must have an owner, a removal date, and a justification. Otherwise, the incident ends, but the extended collection continues. Also define who can read the logs, how long they remain accessible, and who can initiate an export. These are operational choices; no level of compliance is inferred here from adopting a technical format.
Three synthetic paths to compare
Our qualification proposal begins with three requests on a demonstration application. The first uses a response that you designed to come from the cache. The second joins the origin. The third triggers an internal operation deliberately distinct, for example a call to a dummy service. No customer account, no real order, and no measured latency are provided in this article.
For each path, verify that the expected behavior actually occurred: do not name a request "cache" just because you wanted to. Then trace it, the visible steps, and the associated application observations. A path not found must be explained by settings, coverage, or further investigation; do not automatically count it as a success.
| Field of the form | Observation to be recorded during the test |
|---|---|
| Synthetic request | Route, time and test variant |
| Correlation | Identifier or evidence linking the layers |
| Visible steps | Operations found in each tool |
| Missing steps | Instrumentation or selection to verify |
| Hypothesis | Proposed explanation for the delay |
| Proof | Observation that confirms or refutes the hypothesis |
Repeat the paths with the normal rule and then with the targeted rule. Record the volumes generated and the proportion of paths found under the test conditions. Inspect a few exports to confirm the absence of excluded fields. These measures will allow a decision to be made; simply displaying a trace will not be enough to qualify the diagnosis.
Move from the diagram to an operating procedure
The next step is a form that can be used during an incident: where to search for the request, which layers to compare, and who can temporarily broaden the collection. Have it reviewed by someone who did not prepare the pilot. If they cannot find a test request with these instructions, improve the procedure before expanding the scope.
Also prepare for reversibility. Know how to remove a rule, disable an export, and keep only the evidence necessary for analysis. Estimate retention and volumes based on observed usage, then review this estimate as the announced pricing deadline approaches. The terms of the offer may change during the beta.
The favorable choice for Cloudflare Traces rests on a demonstrated correlation between the layers useful to your application, controlled data collection, and an understandable procedure. If the decisive operations remain absent, improve the instrumentation before hoping for a better diagnosis. The tool provides a new scope of observation; your team transforms these observations into actionable evidence.
Sources and verification date
Primary sources opened on October 6, 2026: Cloudflare Observability and Cloudflare Traces, published on October 2. The fictional journey, the sheet, and the proposed rules constitute an original method, without any test carried out or resolution gain measured.